

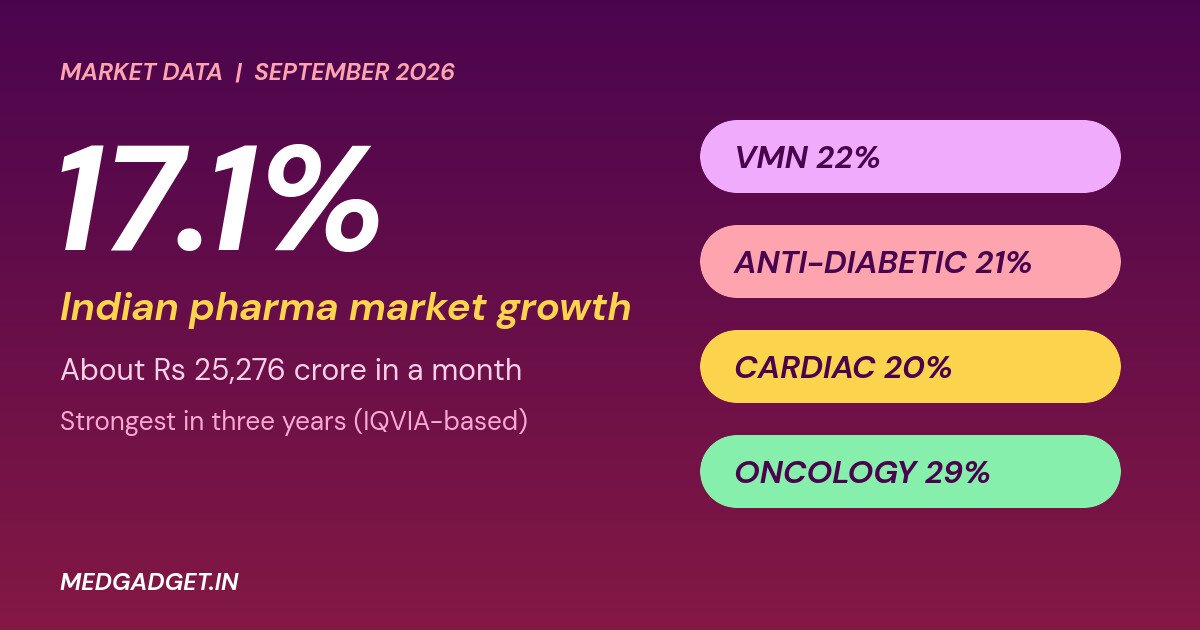
The Indian pharmaceutical market sold about ₹25,276 crore of medicines in September 2026, up 17.1% from a year earlier, according to brokerage research that uses IQVIA data. Reports on the figures describe it as the strongest monthly growth in three years. Chronic therapies, especially anti-diabetic and cardiac medicines, were among the main drivers.
The number is striking because it sits well above the 7% to 9% growth range that the same research cites for the previous two financial years. It also differs from a second data set, so this article lays out both and explains why the gap matters.
Indian pharmaceutical market: key takeaways
- September 2026 sales: about ₹25,276 crore, up 17.1% year on year, per research citing IQVIA data.
- Trailing 12 months: ₹2,75,072 crore, up 13.2%.
- Volume: units grew 5.4% in September, and volume is now the largest contributor to growth.
- Faster therapies: vitamins and nutritionals (22%), anti-diabetic (21%), cardiac (20%).
- Different data set: Pharmarack puts September value growth at about 13.5%, its own record for 2026.
What the Indian pharmaceutical market numbers say
The research reports 17.1% growth in September, up from 13.1% in August and 6.6% in September 2025. For the July to September quarter, sales were about ₹74,610 crore, up 14.7%, compared with 13.9% in the previous quarter and 7.7% a year earlier. The trailing 12-month figure of ₹2,75,072 crore rose 13.2%, against 12.3% in August.
By our calculation, a 17.1% rise to ₹25,276 crore implies a September 2025 base of roughly ₹21,590 crore, so the market added about ₹3,690 crore in a year. That is our own arithmetic from the reported figures, not a number in the research.
Which medicines drove the growth
Chronic therapies grew faster than acute ones. In the research, the monthly split is 19% for chronic and 16% for acute, and the trailing growth rate for chronic therapies is 16.8% against 10.9% for acute. Eight of the ten key therapy groups grew by more than the mid-teens in September.
- Vitamins, minerals and nutritionals: about 22%.
- Anti-diabetic: about 21%, helped by higher sales of high-value brands.
- Cardiac: about 20%.
- Dermatology and pain: about 20% each in one version of the data.
- Anti-infectives: about 9%, and respiratory about 3%, the weakest groups.
Oncology, which sits outside the ten key groups in the research, grew by about 29% in September.
Volume, not just price
A key point in the research is that units, not price increases, now contribute most of the growth. September unit growth was 5.4%. The research gives no separate price figure, so we cannot say how much of the remainder came from price rises and how much from new products. Growth that depends on more patients taking more medicines is generally seen as more durable than growth driven by price rises.
The research attributes the trend to better diagnosis, a greater emphasis on preventive health, tighter regulatory compliance, lifestyle-related chronic disease, and the expansion of medical representative networks into smaller towns.
How companies fared in the Indian pharmaceutical market
The same research lists company growth in September. Zydus led among the large companies at about 20%, followed by Glenmark, Emcure and Torrent at about 19%, and Sun Pharma at about 18%. Dr Reddy’s and Mankind grew about 17%, Lupin and Ipca about 16%, and Cipla, Abbott, Alkem and Alembic about 15%. At the bottom of the list were Indoco and Pfizer, at about 5% each. These are company-level readings of the same data set and should be treated as indicative, since the research does not describe how sales were attributed.
Why a second data set shows 13.5%
Pharmarack reported that September value growth was about 13.5%, with volume growth of about 3.4% to 3.5%, its highest in two years, price growth of about 6.2% and new products adding about 3.8%. Its cardiac growth was 17.7% and anti-diabetes 16.1%. The gap with the 17.1% figure is large. Different data providers track different samples of the supply chain and may define the market differently, so their numbers should not be mixed. We report both and treat neither as the “true” figure.
For related reading, see our report on the Supreme Court hearing on medicine price control in India, or browse more pharmaceutical news.
Risks and caveats on the Indian pharmaceutical market data
- The 17.1% figure comes from brokerage research that cites a data provider. We have not seen the underlying data.
- A second provider shows lower growth, so the headline depends on the source.
- One month, even a record one, does not make a trend. Seasonal factors, such as a receding monsoon, affect respiratory and anti-infective sales.
- Value growth in a month can be influenced by timing of purchases and new launches.
In our assessment, the most reliable message in both data sets is the direction: volumes are recovering, chronic therapies are growing faster than acute ones, and the market is growing faster than in the last two financial years. The precise percentage is less certain.
What to watch next in the Indian pharmaceutical market
- October and November data, to see whether the September jump holds.
- Whether GLP-1 related products keep adding to anti-diabetic sales.
- Recovery in respiratory sales as the season changes.
- Company quarterly results in the weeks ahead, which will show how the market growth translates into earnings.
Frequently asked questions
How fast is the Indian pharmaceutical market growing?
About 17.1% in September 2026 year on year per research using IQVIA data, and about 13.5% per Pharmarack. Trailing 12-month growth was 13.2% in the first data set.
How big is the Indian pharmaceutical market?
About ₹25,276 crore in September 2026 alone, and ₹2,75,072 crore over the trailing 12 months, per the research.
Which therapies led the Indian pharmaceutical market?
Vitamins and nutritionals, anti-diabetic and cardiac medicines were among the fastest, at around 20% to 22%.
Why do two Indian pharmaceutical market data sets differ?
They track different samples and definitions, so numbers from different providers are not comparable.
How we reported this: we relied on broker research using IQVIA data as reported, a Pharmarack data release for September 2026, and the websites of the bodies named. Figures labelled as ours are our own calculations. Last updated: 15 October 2026. This article is news reporting and not investment advice.
[…] impact will depend on price, access and how clinicians use the PD-L1-independent label. See also Indian Pharmaceutical Market Grows 17.1%: Strong Surge. More in our pharmaceutical […]