

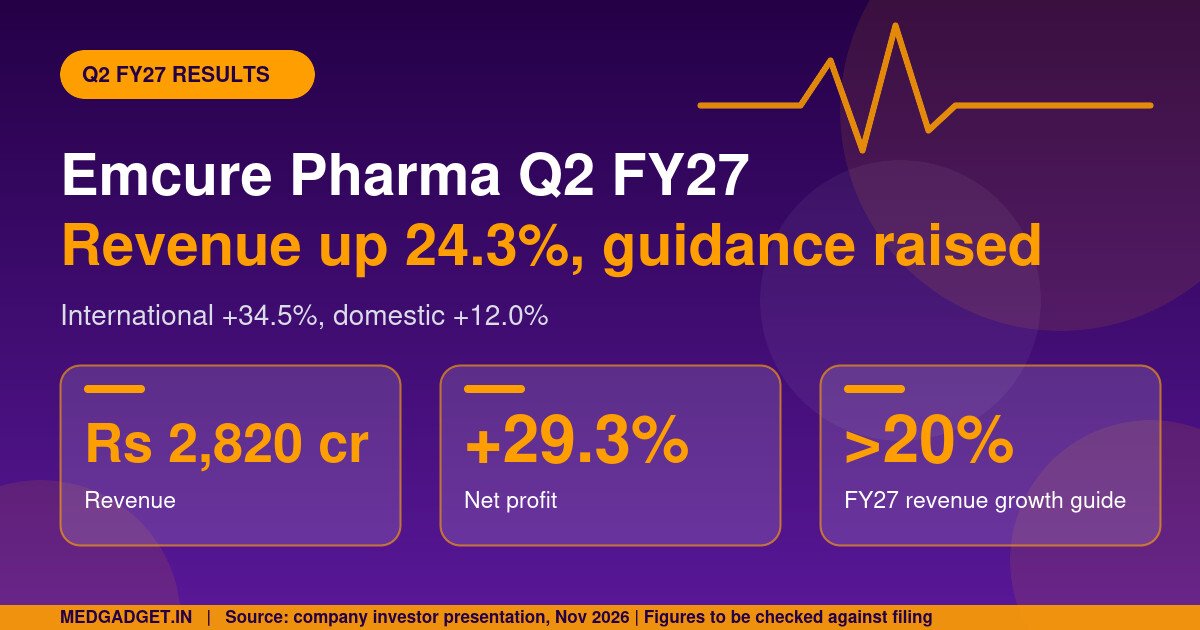
The Emcure Pharma Q2 FY27 results, reported around 3 November 2026 for the quarter ended 30 September, show consolidated revenue of ₹28,205 million (about ₹2,820 crore), up 24.3% from a year earlier, and net profit of ₹3,251 million (about ₹325 crore), up 29.3%. The company also raised its full-year revenue growth outlook to above 20%. The figures below come from a summary of the company’s investor presentation and press reports, so readers should check them against the stock-exchange filing before relying on them. This explainer sets out what drove the quarter, where the numbers conflict and what remains undisclosed.
Key takeaways on the Emcure Pharma Q2 FY27 results
- Revenue: ₹28,205 million, up 24.3% year on year.
- EBITDA: ₹5,748 million, up 30.9%, with a margin of 20.4%, up 103 basis points.
- Net profit: ₹3,251 million, up 29.3%, a margin of 11.5%.
- International business: ₹16,652 million, up 34.5%; domestic business ₹11,553 million, up 12.0%.
- Guidance: FY27 revenue growth above 20%, raised from mid-teens.
- Net debt rose to ₹13,171 million from ₹10,538 million in March 2026.
How the quarter looks in numbers
| Metric | Q2 FY27 | Change |
|---|---|---|
| Revenue | ₹28,205 million | +24.3% year on year |
| EBITDA | ₹5,748 million | +30.9% |
| EBITDA margin | 20.4% | +103 basis points |
| Net profit | ₹3,251 million | +29.3% |
| Net profit margin | 11.5% | +45 basis points |
| Gross margin | 59.5% | +108 bps quarter on quarter, minus 131 bps year on year |
| R&D spend | ₹1,110 million | 3.9% of revenue |
A basis point is one hundredth of a percentage point, so a 103 basis point rise means the margin moved by just over one percentage point. The gross margin is the notable detail: it improved from the previous quarter but is lower than a year earlier, so the profit growth came from operating leverage and not from a richer product mix alone.
Where the growth came from
International sales grew 34.5% to ₹16,652 million. Within that, Europe was ₹6,043 million (up 36.0%), Canada ₹4,312 million (up 24.0%) and the rest of the world ₹6,297 million (up 41.1%); the three add up to the international total. Domestic sales were ₹11,553 million, up 12.0%, an improvement from about 10% in the first quarter.
One figure in the source material does not add up. It describes international sales as 78.6% of revenue, but ₹16,652 million divided by ₹28,205 million is about 59% by our calculation, and the domestic share is about 41%. We use the rupee figures, which are consistent with each other and with the totals.
Half-year picture, cash and debt
For the first half, net profit was ₹6,176 million, up 33%, according to the summary. Cash from operations was ₹7,235 million against ₹2,562 million a year earlier, and capital expenditure was ₹2,877 million. Net debt rose to ₹13,171 million, which the summary attributes to the Mantra earn-out and payments linked to consolidating Gennova. Net debt to EBITDA is reported at 0.6 times and return on capital employed at 24.9%.
The raised outlook
Management now expects FY27 revenue growth above 20%, up from mid-teens, EBITDA margin expansion near the upper end of a 75 to 100 basis point range, domestic growth at or above industry growth and a target of net cash by FY2028. These are company expectations and not results. Press reports said the shares rose about 10% after the announcement; this article does not comment on the share price.
Conflicts and gaps in the reporting
- Profit growth is quoted as 29.3% in the summary and the web address of one report, but another report’s headline says 34% on a profit of ₹325.5 crore. We use 29.3% and flag the difference.
- The split between adjusted and reported profit is not disclosed.
- The 78.6% international share conflicts with the rupee figures, as noted above.
Timeline
- Q1 FY27: domestic growth about 10%.
- 3 November 2026: Q2 FY27 results and raised guidance.
- FY27: revenue growth above 20% targeted.
- FY2028: net cash targeted.
Market context: the global pharmaceutical market
According to Acumen Research And Consulting, the global pharmaceutical market was USD 1.5 trillion in 2022 and is projected to reach USD 2.8 trillion by 2032, a compound annual growth rate of 6.4% for 2023 to 2032, with North America at about 38% and anti-infectives holding the largest therapeutic share. The page also contains a separate statistics line quoting a 38.4% growth rate that contradicts the 6.4% figure, and it was published in July 2024, so we treat the numbers as indicative. Emcure’s reported 24.3% revenue growth is well above that market rate, which reflects company-specific factors and not the market.
Our analysis
In our assessment, the quarter shows the international business doing most of the work, with domestic growth recovering but still lower. The rise in net debt, driven by acquisition-related payments, sits alongside strong operating cash flow, so the balance sheet story depends on how quickly the net cash target is met. The numbers should be confirmed against the filing because of the source conflicts above.
What is not disclosed
- The adjusted versus reported profit split.
- Product-level or therapy-level sales.
- The size of any one-off items in the quarter.
- Detailed assumptions behind the raised guidance.
Risks and caveats
- Figures come from a summary of an investor presentation and press reports and need checking against the filing.
- Guidance is a company expectation and not a result.
- Source conflicts exist on profit growth and the international share.
- This article is news reporting and not investment advice.
What to watch next
- Q3 FY27 results and whether domestic growth keeps improving.
- Progress on reducing net debt.
- Any change to the FY27 guidance.
- Regulatory and pricing developments in Europe and Canada.
General background
For related coverage, see our report on the Emcure merger, and browse the Pharmaceutical section. Company filings are on the National Stock Exchange of India and the BSE websites.
Questions readers are asking about the Emcure Pharma Q2 FY27 results
How much did Emcure earn in Q2 FY27?
Revenue was ₹28,205 million and net profit ₹3,251 million, according to the summary.
What is Emcure expecting for FY27?
Revenue growth above 20%, raised from mid-teens.
Which business grew faster?
International sales, up 34.5%, against 12.0% for domestic.
FAQ
What is EBITDA?
Earnings before interest, tax, depreciation and amortisation.
What does FY27 mean?
The financial year ending 31 March 2027.
What is net debt?
Borrowings minus cash and equivalents.
How we reported this: figures come from a summary of Emcure Pharmaceuticals’ investor presentation and press reports; market figures are attributed to Acumen Research And Consulting; calculations marked as ours are our own. Last updated 5 November 2026. This is news reporting and not investment advice.